Box Plots
Box Plot
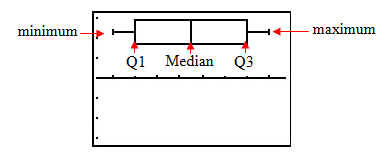
Box plots are another method to display quantitative variables. In descriptive statistics, a box plot is a graphical display depicting groups of numerical data through five-number summaries: the smallest observation (minimum), lower quartile (Q1), median (M), upper quartile (Q3), and largest observation (maximum).
These number summaries divide the data into four equal groups, each representing 25% of the data. The box highlights the middle 50% of the data and the median divides the data into two equal parts. The whiskers on the plot extend from quartile one to the minimum value and from quartile three to the maximum value.
Below is an example of a box plot:

To see the steps in creating a box plot, select the following link: