Box Plots
| Site: | Clare-Gladwin RESD |
| Course: | Michigan Algebra II KHauck |
| Book: | Box Plots |
| Printed by: | Guest user |
| Date: | Wednesday, January 7, 2026, 5:23 AM |
Description
Box Plot
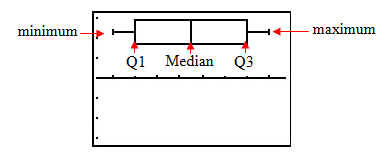
Box plots are another method to display quantitative variables. In descriptive statistics, a box plot is a graphical display depicting groups of numerical data through five-number summaries: the smallest observation (minimum), lower quartile (Q1), median (M), upper quartile (Q3), and largest observation (maximum).
These number summaries divide the data into four equal groups, each representing 25% of the data. The box highlights the middle 50% of the data and the median divides the data into two equal parts. The whiskers on the plot extend from quartile one to the minimum value and from quartile three to the maximum value.
Below is an example of a box plot:

To see the steps in creating a box plot, select the following link:
Video Lessons
To learn how to make a box plot, select one of the following links:
Making Box Plots and Finding the Interquartile Range
Practice
*Note: If Google Docs displays, "Sorry, we were unable to retrieve the document for viewing," refresh your browser.
Answer Key
Answers will vary according to class data.Data Displays Summary
There are some features that should be considered when interpreting any data display. A cluster is a point on the display where the data are clustered around a specific value. A gap is an interval on the display where there is no data. An outlier is a data value that is substantially different from the rest of the data. Each of these features should be investigated to determine if it was reported in error or if it has a specific cause.
To solidify your understanding of data displays, visit the following link to StatTrek.com. It provides examples, tutorials, and interactive practice with answers available. You can move easily from one lesson to the next and skip lessons that you do not need to review.
Statistics Tutorial: Patterns & Data
Sources
Sources used in this book:Embracing Mathematics, Assessment & Technology in High Schools; a Michigan Mathematics & Science Partnership Grant Project
Glencoe, McGraw Hill, "Self-Check Quiz."Stapel, Elizabeth. "Box and Whisker Plots: Quartiles, Boxes and Whiskers."
"Statistics Tutorial: Patterns in Data."