Histograms
Histograms
Relative Frequency
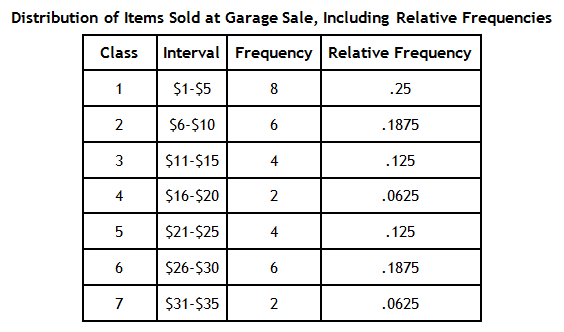
A relative frequency histogram compares each class interval to the total number of items. For example, in the table below the first interval ($1–$5) contains 8 out of the total of 32 items, so the relative frequency of the first class interval is 8/32 or 0.25.


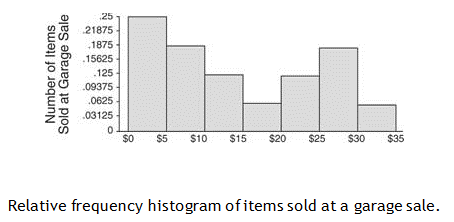
The only difference between a frequency histogram and a relative frequency histogram is that the vertical axis uses relative or proportional frequency instead of simple frequency. See the graph below.
