Histograms
Histograms
Histograms are very similar to bar graphs however they display quantitative variables along both axes. Each bar represents a range of outcome values, rather than just a single value. Histograms also illustrate major features of a distribution quickly.
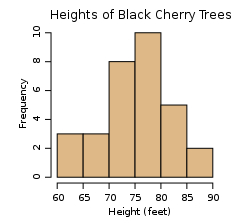
Example The example below is a histogram of the number of cherry trees that reach a certain height.

Along the horizontal axis the variable defined is a continuous quantitative variable. The first bar contains all trees with heights 60 to 65 feet but does not include 65 feet. The second bar contains all trees with heights 65 to 70 feet but does not include 70 feet. The values at the right end of a bar are included in the next bar. Along the vertical axis the variable defined is a discrete quantitative variable, in this case the number of trees within each group.