Histograms
| Site: | Clare-Gladwin RESD |
| Course: | Michigan Algebra II KHauck |
| Book: | Histograms |
| Printed by: | Guest user |
| Date: | Wednesday, February 11, 2026, 3:24 AM |
Description
Histograms
Histograms are very similar to bar graphs however they display quantitative variables along both axes. Each bar represents a range of outcome values, rather than just a single value. Histograms also illustrate major features of a distribution quickly.
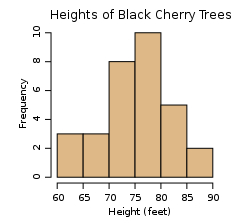
Example The example below is a histogram of the number of cherry trees that reach a certain height.

Along the horizontal axis the variable defined is a continuous quantitative variable. The first bar contains all trees with heights 60 to 65 feet but does not include 65 feet. The second bar contains all trees with heights 65 to 70 feet but does not include 70 feet. The values at the right end of a bar are included in the next bar. Along the vertical axis the variable defined is a discrete quantitative variable, in this case the number of trees within each group.
Relative Frequency
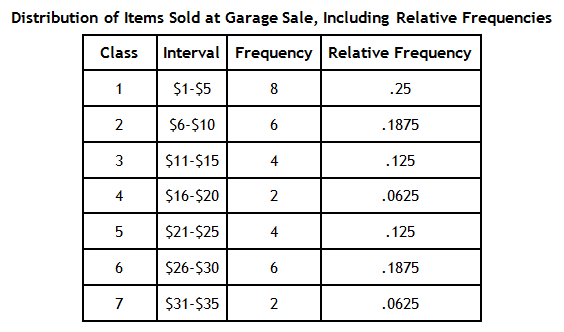
A relative frequency histogram compares each class interval to the total number of items. For example, in the table below the first interval ($1–$5) contains 8 out of the total of 32 items, so the relative frequency of the first class interval is 8/32 or 0.25.
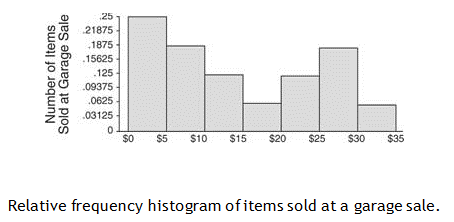
The only difference between a frequency histogram and a relative frequency histogram is that the vertical axis uses relative or proportional frequency instead of simple frequency. See the graph below.

Video Lessons
To learn how to make a histogram, select one of the following links:
Displaying Data in a Histogram
Guided Practice
To solidify your understanding of histograms and bar graphs, visit the following link to Holt, Rinehart, and Winston Homework Help Online. It provides examples, video tutorials, and interactive practice with answers available. The Practice and Problem Solving section has two parts. The first part offers practice with a complete video explanation for the type of problem with just a click of the video icon. The second part offers practice with the solution for each problem only a click of the light bulb away.
Guided PracticePractice
*Note: If Google Docs displays, "Sorry, we were unable to retrieve the document for viewing," refresh your browser.
Answer Key
*Note: If Google Docs displays, "Sorry, we were unable to retrieve the document for viewing," refresh your browser.
Sources
Sources used in this book:CliffsNotes.com. Relative Frequency Histogram. 26 Jul 2010
Embracing Mathematics, Assessment & Technology in High Schools; a Michigan Mathematics & Science Partnership Grant Project
Glencoe, McGraw-Hill, "The Frequency Distribution ."
Holt, Rinehart & Winston, "Displaying Data in a Histogram."
Saskatchewan Schools, "Histograms."
Shodor, "Histogram."
Shodor, "Histograms and Bar Graphs."
Wikipedia, "Histogram."