Control Charts
Control Charts
Out-of-Control
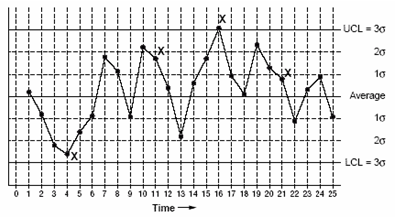
Using the control chart below, the following situations represent out-of-control signals and should be investigated:
- A single point outside the control limits, such as point sixteen is above the upper control limit (UCL).
- Two out of three successive points are on the same side of the centerline and further than 2 standard deviations from it; point 4 sends that signal.
- Four out of five successive points are on the same side of the centerline and further than 1 standard deviation from it; point 11 sends that signal.
- A run of eight in a row are on the same side of the centerline, or 10 out of 11, 12 out of 14 or 16 out of 20. Point 21 is the eighth point in a row above the centerline.
- Obvious consistent or persistent patterns that suggest something unusual about your data and your process.
