Bar Graphs
Bar Graphs
Bar Graphs
Bar graphs are used to show the comparison of categorical data. This type of graph consists of parallel bars or rectangles. The lengths of the bars correspond to the frequency with which specified quantities occur within a category of data. When creating a bar graph, the variable along the horizontal axis will usually be categorical while the vertical axis will usually have a quantitative variable.
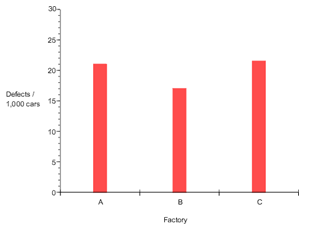
Example The bar graph below represents the number of defects per 1,000 cars for three factories.

Along the horizontal axis the categorical variable is defined as factory A, B, or C. Along the vertical axis the quantitative variable is defined as number of defects per 1,000 cars.