Logarithms
Graphing
Example
Graph the function ![]()
Step 1. Switch the values of x and y and transform the log to exponential form.

Step 2. Make a table of values for the exponential function.

Step 3. The table above is the inverse of the one needed so switch the input and output. This will create a set of ordered pairs that models the function ![]() .
.

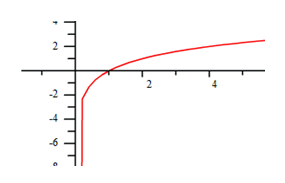
Step 4. Graph the function.

Step 5. State the Domain & Range.
The x-values are approaching an asymptote at x = 0 and the y-values can be any number.
![]()