Logarithms
| Site: | Clare-Gladwin RESD |
| Course: | Michigan Algebra II KHauck |
| Book: | Logarithms |
| Printed by: | Guest user |
| Date: | Friday, January 16, 2026, 10:34 PM |
Description
Graphing
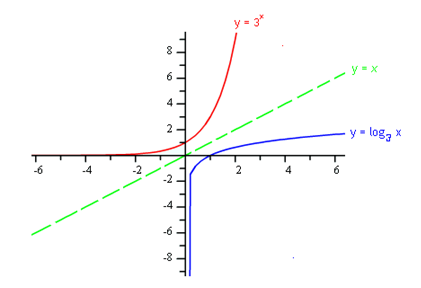
Since logarithms and exponentials are inverse functions, the graphs will follow the inverse function rules. When graphing logarithmic functions, the values of x and y switch. Therefore, the graphs are reflections across the line y = x.

Typically, when graphing a new function, it is easiest to start with a table of values. Unfortunately for logarithmic functions, it is difficult to select input values and much easier to look at the inverse function.
Example
Graph the function ![]()
Step 1. Switch the values of x and y and transform the log to exponential form.

Step 2. Make a table of values for the exponential function.

Step 3. The table above is the inverse of the one needed so switch the input and output. This will create a set of ordered pairs that models the function ![]() .
.

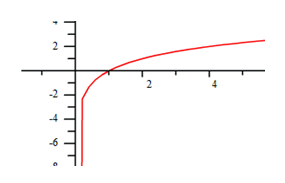
Step 4. Graph the function.

Step 5. State the Domain & Range.
The x-values are approaching an asymptote at x = 0 and the y-values can be any number.
![]()
Transformations
The transformations of functions that were presented in the Families of Functions unit also apply to logarithmic functions. The following list shows how the patterns apply to logarithms. translates the graph a units up; asymptote at x = 0
  translates the graph a units down; asymptote at x = 0
  translates the graph a units right; asymptote at x = a.
 translates the graph a units left; asymptote at x = -a.
  reflects the graph across the x-axis; asymptote at x = 0.
 reflects the graph across the y-axis; asymptote at x = 0.
Video Lesson
To learn how to graph log functions, select the following link:
Graphing Logarithmic FunctionsInteractive Activity
Graphing Logarithmic and Exponential FunctionsGuided Practice
To solidify your understanding of transformations of logarithmic and exponential graphs, visit the following link to Holt, Rinehart, and Winston Homework Help Online. It provides examples, video tutorials and interactive practice with answers available. The Practice and Problem Solving section has two parts. The first part offers practice with a complete video explanation for the type of problem with just a click of the video icon. The second part offers practice with the solution for each problem only a click of the light bulb away.
Practice
Graphing Log Functions Worksheet
*Note: If Google Docs displays, "Sorry, we were unable to retrieve the document for viewing," refresh your browser.
Video Lesson:Â
To learn how to graph log functions, view the following video:
Answer Key
Graphing Log Functions Answer Key
*Note: If Google Docs displays, "Sorry, we were unable to retrieve the document for viewing," refresh your browser.
Sources
Sources used in this book:
"Graphing Logarithms and Exponentials." http://www.ltcconline.net/greenl/java/IntermedCollegeAlgebra/LogGra ph/logGraph.html (accessed 7/13/2010).
Holt, Rinehart & Winston, "Exponential and Logarithmic Functions." http://my.hrw.com/math06_07/nsmedia/homework_help/alg2/alg2_ch 07_07_homeworkhelp.html (accessed 7/13/2010).
Holt, Rinehart & Winston, "Transforming Logarithmic Functions." http://my.hrw.com/math06_07/nsmedia/lesson_videos/alg2/player.ht ml?contentSrc=7158/7158.xml (accessed 7/13/2010).
Embracing Mathematics, Assessment & Technology in High Schools; a Michigan Mathematics & Science Partnership Grant Project