Exponentials
Decay
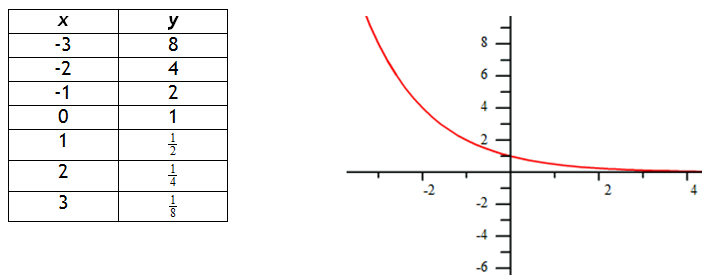
Recall that the function  would create the following table and graph:

Notice that the graph decreases more rapidly as x increases. The right side of the graph is approaching, but never touches the line y = 0, which is the graph's asymptote. Therefore, the domain of this function is ![]() and the range of the function is
and the range of the function is ![]() .
.