Graphical Behavior
Graphical Behavior
End Behavior
Example 3
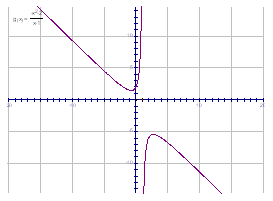
Determine the end behavior of the function.
![]()

Because there is no horizontal asymptote, the end behavior is determined by finding the ratio of the leading terms: ![]() or y = -x. Therefore, g(x) has the same end behavior as the linear function
or y = -x. Therefore, g(x) has the same end behavior as the linear function ![]() . As the x-values approach negative infinity, the y-values approach positive infinity. As the x-values approach positive infinity, the y-values approach negative infinity.
. As the x-values approach negative infinity, the y-values approach positive infinity. As the x-values approach positive infinity, the y-values approach negative infinity.