Graphical Behavior
| Site: | Clare-Gladwin RESD |
| Course: | Michigan Algebra II KHauck |
| Book: | Graphical Behavior |
| Printed by: | Guest user |
| Date: | Friday, February 13, 2026, 7:17 PM |
Description
Graphical Behavior
Discontinuities
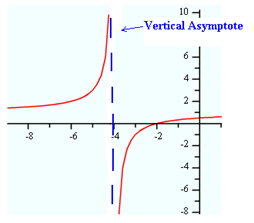
Discontinuities of the graph are the undefined points of the rational function. Remember when simplifying rational expressions sometimes there are excluded values which create points of discontinuity.
Points of discontinuity or exception points can occur in two different forms:
- the denominator of the rational function equals zero and the numerator does not creating a vertical asymptote
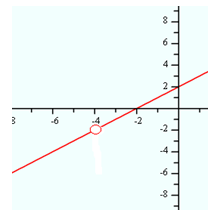
- the denominator and numerator of the rational function equal zero creating a hole.
Remember that a vertical asymptote is a vertical line that the graph of the function approaches but never intersects. When the denominator equals zero and the numerator does not, this discontinuity is a vertical asymptote.
Holes
A hole is a point on the graph where the value of the function is not defined. If the numerator and denominator of a rational function have a common factor, they will cancel when simplifying. The cancelled value creates a hole in the graph. To determine the x -coordinate of a hole, set the cancelled factor equal to zero and solve. To determine the y -coordinate, plug the x -value into the simplified function and solve.
Example 1
Find the points of discontinuity for the rational function.
![]()
Step 1. Factor the rational function completely.
![]()
Step 2. Determine the points of discontinuity by setting the factors in the denominator equal to zero and solving.
![]() or
or ![]()
![]() or
or ![]()
Step 3. Simplify the rational function.

![]()
Step 4. Determine the vertical asymptote.
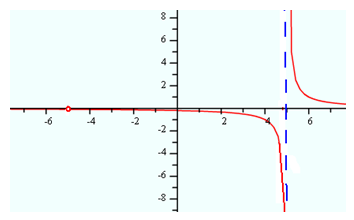
x = 5 is a vertical asymptote because it is a zero of the denominator only.
Step 5. Determine the coordinates of the hole.
There is a hole at x = -5 because the factor (x + 5) was cancelled in both the numerator and denominator. To determine the y-value, plug x = -5 into the simplified function and solve.
![]()
Coordinates of the hole: ![]()
Ex 1 Graph
The graph of the function ![]() is below:
is below:
Example 2
Find the points of discontinuity for the rational function.

Step 1. Factor the rational function completely.
This function is in factored form.
Step 2. Determine the points of discontinuity by setting the factors in the denominator equal to zero and solving.
x – 2 = 0 or x + 3 = 0
![]() or
or ![]()
Step 3. Simplify the rational function.

Step 4. Determine the vertical asymptote.
x = -3 is a vertical asymptote because after simplifying the function it is still a zero of the denominator.
Step 5. Determine the coordinates of the hole.
There is a hole at x = 2 because the factor (x - 2) is eliminated from the denominator during simplification. To determine the y-value, plug x = 2 into the simplified function and solve.
![]()
Coordinates of the hole: (2,0)
Ex 2 Graph
 Â is below.
 is below.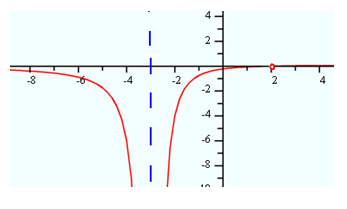
Video Lesson
To learn how to determine a hole in a rational function select the following link:
Horizontal Asymptotes
Remember a horizontal asymptote is a horizontal line that the graph of the function approaches, but unlike vertical asymptotes the graph can cross horizontal asymptotes. To determine the horizontal asymptotes of a rational function, compare the degree of the numerator to the degree of the denominator.
Rule 1 If the degree of the numerator is smaller than the degree of the denominator, then the horizontal asymptote has the equation y = 0.
Example. Determine the horizontal asymptote of the function.
![]()
Since the numerator is first degree (linear) and the denominator is second degree (quadratic), the degree of the numerator is smaller than the degree of the denominator. Therefore, the function has a horizontal asymptote at the x-axis (y = 0).
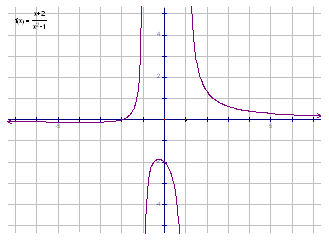
Notice that the function crosses its horizontal asymptote.
Rule 2
If the degree of the numerator is the same as the degree of the denominator, then the horizontal asymptote has the equation ![]() , where a is the leading coefficient of the numerator and b is the leading coefficient of the denominator.
, where a is the leading coefficient of the numerator and b is the leading coefficient of the denominator.
Example. Determine the horizontal asymptote of the function.
![]()
Both the numerator and denominator are linear, so they have the same degree. The horizontal asymptote is therefore ![]() or y = 2 .
or y = 2 .
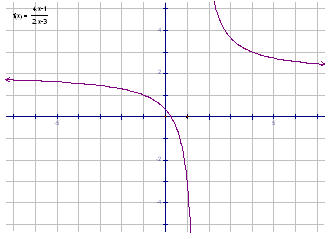
Rule 3
If the degree of the numerator is larger than the degree of the denominator, then there is no horizontal asymptote.
Example. Determine the horizontal asymptote of the function.
![]()
Since the numerator is second degree (quadratic) and the denominator is first degree (linear), the degree of the numerator is larger than the degree of the denominator. Therefore, the function has no horizontal asymptotes.
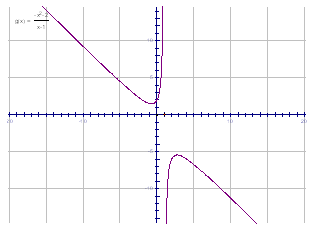
End Behavior
The end behavior of a rational function is what the graph looks like as x approaches positive and negative infinity. Unlike polynomial functions, the end behavior of rational functions has no pattern. Therefore, the asymptotes play a key role in determining a rational function’s end behavior.
Example 1 Determine the end behavior of the function.
![]()
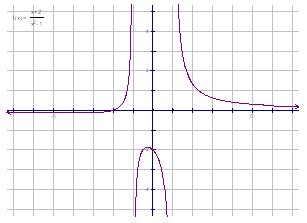
As the x-values approach negative infinity, the graph approaches the horizontal asymptote from below. As the x-values approach positive infinity, the graph approaches the horizontal asymptote from above.
Example 2
Determine the end behavior of the function.
![]()
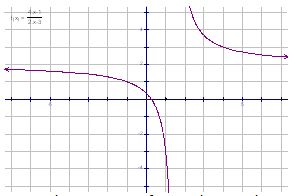
As the x-values approach negative infinity, the graph approaches the horizontal asymptote from below. As the x-values approach positive infinity, the graph approaches the horizontal asymptote from above.
Example 3
Determine the end behavior of the function.
![]()
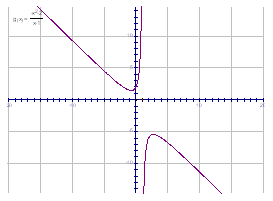
Because there is no horizontal asymptote, the end behavior is determined by finding the ratio of the leading terms: ![]() or y = -x. Therefore, g(x) has the same end behavior as the linear function
or y = -x. Therefore, g(x) has the same end behavior as the linear function ![]() . As the x-values approach negative infinity, the y-values approach positive infinity. As the x-values approach positive infinity, the y-values approach negative infinity.
. As the x-values approach negative infinity, the y-values approach positive infinity. As the x-values approach positive infinity, the y-values approach negative infinity.
Domain
The domain of a rational function is all real numbers, excluding values that lead to a zero in the denominator. These values have been presented as excluded values or points of discontinuity.
Example 1 Describe the Domain.
Step 1. Factor the denominator.
![]()
Step 2. Using Zero Product Property set each factor equal to zero and solve.
![]() or
or ![]()
![]() or
or ![]()
Step 3. The domain will be all real numbers excluding the value(s) from step 2.
The domain is: all real numbers excluding x = 3, x = -3.
This can be written in set notation as: ![]()
Example 2
Describe the Domain.
Step 1. Factor the denominator.
![]()
Step 2. Using Zero Product Property set each factor equal to zero and solve.
x = -4 or x = -1
Step 3. The domain will be all real numbers excluding the value(s) from step 2.
The domain is: ![]()
Range
Describe the Range.
![]()
Step 1. Determine the equation of the horizontal asymptote.
Since the degree of the numerator is smaller than the degree of the denominator, the equation of the asymptote is y = 0.
Step 2. The range will be all real numbers excluding the value from step 1.
The range is: all real numbers excluding y = 0.
This can be written in set notation as: ![]() .
.
Video Lesson: Domain & Range
To learn how to identify the domain and range of rational functions select the following link:
Finding x-intercepts
Points where the graph cross the x-axis are the x-intercepts, where y = 0. The x-intercepts of a function are also known as the zeros or real roots of the corresponding equation. In the case of rational functions, x-intercepts exist when the numerator equals zero.
To determine the x-intercepts of the function, set the numerator equal to zero and solve for x. Eliminate the excluded values because the function will be undefined and will not cross the x-axis.
Example 1 Find the x-intercepts of the function.
![]()
Step 1. Simplify the function completely.
![]()
Since x = -4 is an excluded value, it can not be an x-intercept.
Step 2. Using the Zero Product Property, set the factor(s) in the numerator equal to zero and solve.
![]()
![]() or
or ![]()
![]() or
or ![]()
x-intercepts: (2, 0) or (1, 0)
Example 2
Find the x-intercepts of the function.
![]()
Step 1. Simplify the function completely.
![]()

![]()
Since ![]() and x = 2 are excluded values, they can not be an x-intercept.
and x = 2 are excluded values, they can not be an x-intercept.
Step 2: Using the Zero Product Property, set the factor(s) in the numerator equal to zero and solve.
x – 4 = 0
x = 4
x-intercept(s): (4, 0)
Finding y-intercepts
Where the graph of the function crosses the y-axis is the y-intercept, where x = 0. Functions can have only one y-intercept. The y-intercept cannot be determined if the function is undefined.
Example 1 Find the y-intercept of the function.

Step 1. Simplify the function completely.
This function is in simplest form. When x = 0, the denominator is 5, therefore the function is defined.
Step 2. Substitute x = 0 into your equation and solve.
![]()
![]()
y-intercept: 
Example 2
Find the y-intercept of the function.
![]()
Step 1. Simplify the function completely.
![]()
![]()
![]()
![]()
When x = 0, the denominator is 1, therefore the function is defined.
Step 2. Substitute x = 0 into your simplified equation and solve.
![]()
![]()
![]()
y-intercept: (0, 3)
Video Lesson: Graphing Rationals
To learn how to graph rational functions select the following link:
Graphing Rational Functions
More Graphing
To see more examples on graphing rational functions select the following link:
More Graphing Rational Functions
Guided Practice
To solidify your understanding of manipulating rational expressions, visit the following link to Holt, Rinehart and Winston Homework Help Online. It provides examples, video tutorials and interactive practice with answers available. The Practice and Problem Solving section has two parts. The first part offers practice with a complete video explanation for the type of problem with just a click of the video icon. The second part offers practice with the solution for each problem only a click of the light bulb away.
Guided Practice
Practice
*Note: If Google Docs displays “Sorry, we were unable to retrieve the document for viewing.†refresh your browser.
Video Lesson
Answer Key
Answer Key for Graphing Rationals WorksheetSources
Sources used in this book:Bhawalkar, Pradnya, and Kim Johnston. "Horizontal Asymptotes." Connexions. April 8, 2007. http://cnx.org/content/m13606/1.8/.
Embracing Mathematics, Assessment & Technology in High Schools; a Michigan Mathematics & Science Partnership Grant Project
Holt, Rinehart & Winston, "Graphing Rational and Radical Functions." http://my.hrw.com/math06_07/nsmedia/homework_help/alg2/alg2_ch08_04_homeworkhelp.html (accessed 06/25/2010).
Singh, Sunil. "Rational function." Connexions. September 21, 2008. http://cnx.org/content/m15293/1.10/.