Logarithms
Graphing
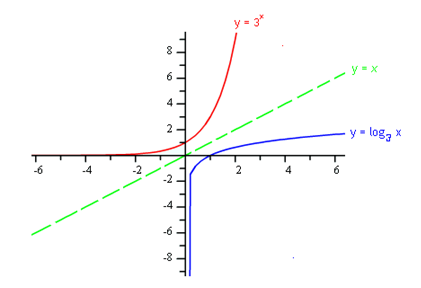
Since logarithms and exponentials are inverse functions, the graphs will follow the inverse function rules. When graphing logarithmic functions, the values of x and y switch. Therefore, the graphs are reflections across the line y = x.

Typically, when graphing a new function, it is easiest to start with a table of values. Unfortunately for logarithmic functions, it is difficult to select input values and much easier to look at the inverse function.