Control Charts
Control Charts
Basic Procedure
In order to make a control chart, follow the procedure below:
- Collect your data.
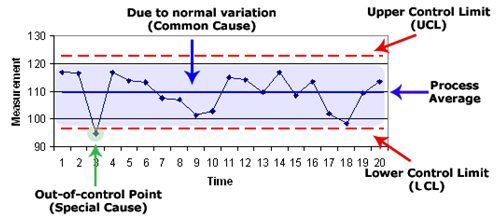
- Plot the center or mean; it is usually the target value for the data set.
- Plot the upper and lower control limits usually the mean plus/minus three times the standard deviation.
- Plot data points collected.
- Look for "out-of-control signals" on the control chart. When one is identified, mark it on the chart and investigate the cause.
