Variation
Normal Distribution
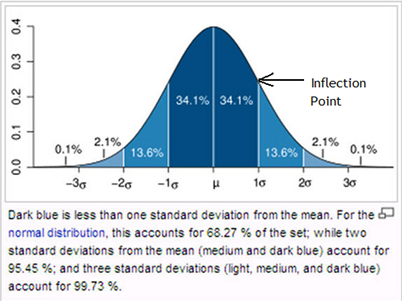
Standard Deviation is used to describe the normal distribution of data. When representing data using a bell curve,the mean is the middle value and the standard deviation is used to distribute the data evenly. The figure below shows how mean and standard deviation are represented graphically on a bell curve.

Mean is found at the center of the normal curve. Standard deviation can be found by measuring the distance from the mean to the inflection points (note: inflection points are where the curve changes concavity - curved up to curved down).
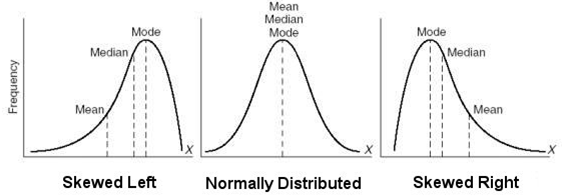
The data determines the shape of a distribution curve. See the graphs below for some common examples.
