Variation
| Site: | Clare-Gladwin RESD |
| Course: | Michigan Algebra II KHauck |
| Book: | Variation |
| Printed by: | Guest user |
| Date: | Sunday, February 15, 2026, 12:50 AM |
Description
Variation
Variation refers to the amount that values vary among themselves or the spread of the data. The three main measures of variation are range, variance, and standard deviation. The range of a data set is the difference between the highest value and the lowest value. Algebraically, the standard deviation measures the spread or average distance each point is from the mean. Graphically, the standard deviation helps to interpret the distribution of a set of numbers. The notation used for standard deviation is the greek letter sigma, ![]() The variance describes how far values lie from the mean. The notation used for variance is the greek letter sigma squared,
The variance describes how far values lie from the mean. The notation used for variance is the greek letter sigma squared, ![]()
The formula for standard deviation is: 
Example 1
Find the range of the following set of values:
![]()
To find the range, subtract the lowest value from the highest value.
9 - 2 = 7
Range = 7
Example 2
Find the variance and standard deviation of the following set of values:
![]()
Step 1. Find the mean of the data.

Step 2. Find the difference between each data point and the mean.

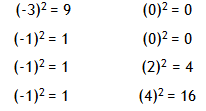
Step 3. Square each value from Step 2.

Step 4. Find the mean of the values from Step 3.

Variance = 4
Normal Distribution
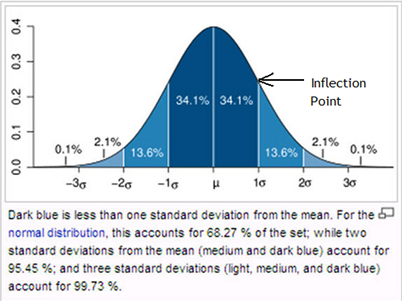
Standard Deviation is used to describe the normal distribution of data. When representing data using a bell curve,the mean is the middle value and the standard deviation is used to distribute the data evenly. The figure below shows how mean and standard deviation are represented graphically on a bell curve.

Mean is found at the center of the normal curve. Standard deviation can be found by measuring the distance from the mean to the inflection points (note: inflection points are where the curve changes concavity - curved up to curved down).
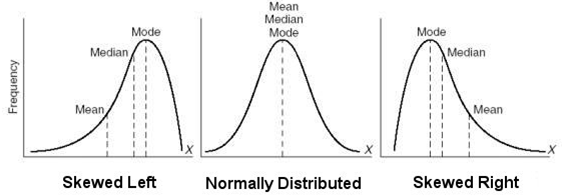
The data determines the shape of a distribution curve. See the graphs below for some common examples.

Video Lessons
To learn how to calculate standard deviation, select the following link:
Finding Mean and Standard Deviation
To learn how outliers affect mean and standard deviation, select the following link:
To learn how to find standard deviation using a graphing calculator, watch the following video:
Guided Practice
To solidify your understanding of standard deviation, visit the following link to Holt, Rinehart, and Winston Homework Help Online. It provides examples, video tutorials, and interactive practice with answers available. The Practice and Problem Solving section has two parts. The first part offers practice with a complete video explanation for the type of problem with just a click of the video icon. The second part offers practice with the solution for each problem only a click of the light bulb away.
Practice
*Note: If Google Docs displays, "Sorry, we were unable to retrieve the document for viewing," refresh your browser.
Answer Key
Sources
Sources used in this book:CliffsNotes.com. Frequency Distribution. 27 Jul 2010
Embracing Mathematics, Assessment & Technology in High Schools; a Michigan Mathematics & Science Partnership Grant Project
Holt, Rinehart & Winston, "Finding Mean and Standard Deviation."Holt, Rinehart & Winston, "Probability and Statistics."
Holt, Rinehart & Winston, "Understanding Outliers."
TradeKing, "Standard deviation - normal distribution."
Waner, Stefan and Costenoble, Steven R. "Measures of Dispersion."
"YouTube - How to calculate Standard Deviation with TI Graphing Calculator."http://www.youtube.com/watch?v=DMOXzwC2vzg (accessed /26/2010).