Graphing
Two Variables
The steps for graphing two-variable linear inequalities are very much the same as graphing a linear equation. First, determine the slope and y-intercept and use them to plot points on the line. Next, use the appropriate notation, much like the number line problem. If the solution is included, use a solid line and if the solution is not included use a dashed line. Finally, shade the graph to indicate the greater than or less than part of the inequality.
Example 1 Graph the solution set of y < 2x + 3.
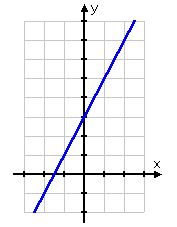
Step 1. Change the inequality to an equation to find the boundary line and graph the line.
In this case, the equation part of the inequality produces a solid line at
y = 2x + 3.

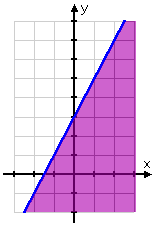
Step 2. Using the inequality, test a point on either side of the boundary to determine where to shade. Shade the appropriate side.
Test the point (0,0).
y < 2x + 3
0 < 2(0) + 3
0 < 3
Since this is a true statement, (0, 0) satisfies the inequality.
Shade the side containing that point.

The points on the line and in the shaded region are the solutions to the inequality.