Graphing
| Site: | Clare-Gladwin RESD |
| Course: | Michigan Algebra I |
| Book: | Graphing |
| Printed by: | Guest user |
| Date: | Saturday, January 31, 2026, 4:07 PM |
Description
Introduction
Linear inequalities containing one variable can be graphed on a number line or in a coordinate plane. Linear inequalities containing two variables can be graphed in a coordinate plane, similar to graphing a linear equation.
One Variable
When graphing inequalities on a number line use the appropriate notation. A closed circle indicates that the point is included in the solution set and an open circle indicates that the point is not part of the solution set.
Example
Graph x > 2
Step 1. Draw the number line.

Step 2. Find the value and mark it with the appropriate notation. An open dot indicates that the point x = 2 is not included in the solution.

Step 3. Shade everything to the right, showing "greater than".

Two Variables
The steps for graphing two-variable linear inequalities are very much the same as graphing a linear equation. First, determine the slope and y-intercept and use them to plot points on the line. Next, use the appropriate notation, much like the number line problem. If the solution is included, use a solid line and if the solution is not included use a dashed line. Finally, shade the graph to indicate the greater than or less than part of the inequality.
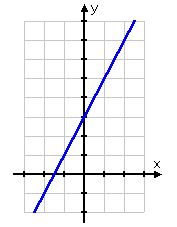
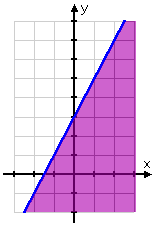
Example 1 Graph the solution set of y < 2x + 3.
Step 1. Change the inequality to an equation to find the boundary line and graph the line.
In this case, the equation part of the inequality produces a solid line at
y = 2x + 3.

Step 2. Using the inequality, test a point on either side of the boundary to determine where to shade. Shade the appropriate side.
Test the point (0,0).
y < 2x + 3
0 < 2(0) + 3
0 < 3
Since this is a true statement, (0, 0) satisfies the inequality.
Shade the side containing that point.

The points on the line and in the shaded region are the solutions to the inequality.
Example 2
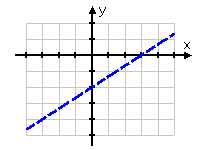
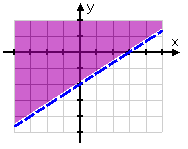
Graph the solution to 2x - 3y < 6.
Step 1. Solve for y.
2x - 3y < 6
-3y < -2x + 6
![]()
*Note: The inequality sign is reversed in the last line.
Don't forget to reverse the inequality if multiplying or dividing by a negative!
Step 2. Change the inequality to an equation to find the boundary line and graph the line.
In this case, the inequality produces a dashed line at ![]() .
.

Step 3. Using the inequality, test a point on either side of the boundary to determine where to shade. Shade the appropriate side.
Test the point (0,0).
Since this is a true statement, (0, 0) satisfies the inequality.
Shade the side containing that point.

The points in the shaded region only are the solutions to the inequality.
Video Lesson
To see more examples on graphing linear inequalities, select the following link:
Guided Practice
To solidify your understanding of graphing linear inequalities, visit the following link to Holt, Rinehart and Winston Homework Help Online. It provides examples, video tutorials and interactive practice with answers available. The Practice and Problem Solving section has two parts. The first part offers practice with a complete video explanation for the type of problem with just a click of the video icon. The second part offers practice with the solution for each problem only a click of the light bulb away.
Practice
Graphing Linear Inequalities Worksheet
*Note: If Google Docs displays "Sorry, we were unable to retrieve the document for viewing," refresh your browser.
Answer Key
Graphing Linear Inequalities Key
*Note: If Google Docs displays "Sorry, we were unable to retrieve the document for viewing," refresh your browser.
Sources
Holt, Rinehart, & Winston. "Systems of Equations & Inequalities." http://my.hrw.com/math06_07/nsmedia/homework_help/alg1/
alg1_ch06_05_homeworkhelp.html (accessed August 15, 2010)
Kutztown University, "Numbered Number Lines." http://faculty.kutztown.edu/schaeffe/Graphics/NumberLines/
Numbered_Number_Line.doc (accessed 08/22/2010).
Stapel, Elizabeth. "Graphing Linear Inequalities." Purplemath. Available from http://www.purplemath.com/modules/ineqgrph.htm. Accessed 15 August 2010