Graphical Behavior
Looking for Patterns
Example 1
Graph the polynomial p(x) = (x - 3)(x + 2)(x + 5).
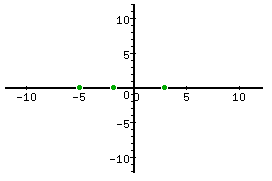
Step 1. Plot the roots as x-intercepts.
In the polynomial, p(x) = (x - 3)(x + 2)(x + 5), the roots are 3, -2, and -5.

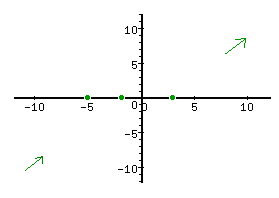
Step 2. Use the leading coefficient to determine the end behavior.
To find the coefficient, multiply the factors and get x3 + 4x2 - 11x - 30. Or just multiply the x-terms, in this case, (+x)(+x)(+x) which multiplies to (+x3).
The leading coefficient is positive 1, which implies the graph will go from bottom left to upper right.

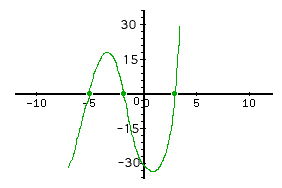
Step 3. Substitute the value x = 0, find the value of y.
The point (0,-30) is on the graph and will help in creating the curve. The sketch of the graph is:

*Note: Since this is only a sketch, ALL data may not be exact.