Piecewise
| Site: | Clare-Gladwin RESD |
| Course: | Michigan Algebra I |
| Book: | Piecewise |
| Printed by: | Guest user |
| Date: | Saturday, January 31, 2026, 4:10 PM |
Description
Piecewise Functions
Introduction
A piecewise function is a function that combines two or more functions. It can be of the same kind of functions, for example, the functions can all be linear. Or a piecewise function can be made up of different kinds of functions - a quadratic and a linear function on the same graph. In this section, you will see how to recognize, graph, and evaluate piecewise functions.Evaluating
Consider the piecewise function below. It consists of two functions with different domains. It says that if x is smaller than or equal to 2, the formula for the function is f(x) = -x. If x is greater than 2, the formula is f(x) = x.
The domain of function f is the set of all real numbers, since f is defined everywhere for all real numbers. In other words, there is not one value for x that could not be substituted into the function.
To evaluate a function when there are multiple functions, look at the intervals on the right of the functions. To evaluate f (3), use the lower function as that is the one to use for all values of x greater than 2. f (3) = x = 3. To evaluate f (-4) use the upper function f(x ) = - x . Replacing x with -4: f (-4) = -(-4) = 4.
Example
Using the function below, determine f(10) and f(-2). 
Step 1. Determine which function to use based on the domain values.
f (10) belongs in the top domain, so use the top function.
f (-2) belongs in the bottom domain, so use the bottom function.
Step 2. Substitute the domain value into the correct function and solve.

Graphing
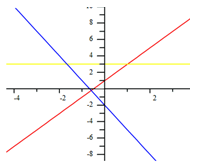
Use the following steps to graph piecewise functions:1) In pencil, sketch a graph of each function represented on the same coordinate graph.
3) Determine if the graph is continuous. A graph is continuous if you can sketch it without lifting your pencil off the paper. In other words, the graph doesn't "jump" or have any gaps. To determine if a function is continuous, evaluate each piece of the function at the end of the intervals.
Example 1
Make a graph of the function:
Step 1. Break the function into its separate functions and domain intervals.
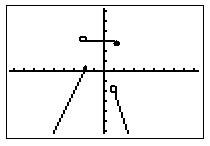
This function is actually 3 different functions combined. The key point here is that the inequalities for x tell which function is on which interval of the domain. In other words, if x is less than or equal to -2, then f(x) = 2x + 1. If x is between -2 and 1 (including 1, but not -2), then f(x) = 3. If x is greater than 1, then f(x) = -3x - 2.
Step 2. Graph each function on the same coordinate plane using a pencil.
Example 1 Continued

Example 2
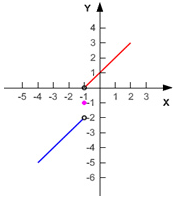
The graph to the right is a graph of:|
{x - 1, if x < -1 (in blue) |

|
The open dot at x = -1 (red line) shows that for the function x +1, x cannot be -1. At y = -1, there is just a dot because that is the only value x can be. For the function x - 1 there is an open dot because only the values where x is less than -1 are allowed.
Application
Few real-life, practical situations can actually be modeled by the same function over the course of the entire time it is modeling. This brings cause for studying piecewise functions. For example, a piecewise function can represent "graduated" income tax versus a flat tax rate. A flat income tax would tax people at the same rate regardless of their income, for instance a flat tax of 30% of your income. Some people think that flat tax is unfair for those in or near the poverty level because they are getting taxed at the same rate as those in a higher income bracket. Our income tax is based on a graduated tax calculation. In a graduated tax system, the first $15,000 you earn may be taxed at a rate of 20%, the next $45,000 you make may be taxed at a rate of 25%, and any more money that you make above $45,000 could be taxed at a rate of 35%.
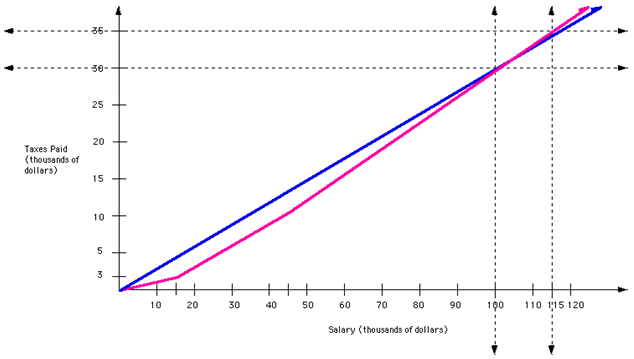
Below is a graph of this situation:

The graph in pink represents the graduated tax and is a piecewise function. It is a continuous piecewise function created by three different linear functions. Notice the change in slope when x = 15,000 and again when x = 45,000.
The graph in blue represent the flat tax and is not a piecewise function. Notice that it has a constant slope.
Application #2
Suppose you plan to buy many blank compact discs. When you check price lists, you find that if you buy less than a 1000 CDs you pay $0.74 each. However if you buy between 1000 and 2000 CD's the price drops to $0.69 each for the second thousand. Also, for any purchase of more than 2000, the price for the CD's drops again to $0.64 for each after the 2000 th. This is another example of a piecewise function. There are many real-life applications of piecewise functions found in science and business.Video Lesson
For a video lesson on how to graph piecewise functions, select the following link:Piecewise Functions
Using a TI83/84 Calculator to Graph
For instructions on how to use a TI 83/84 calculator to graph piecewise functions, select the following link:Calculator Instructions
Guided Practice
To solidify your understanding of piecewise functions, visit the following link to Holt, Rinehart and Winston Homework Help Online. It provides examples, video tutorials and interactive practice with answers available. The Practice and Problem Solving section has two parts. The first part offers practice with a complete video explanation for the type of problem with just a click of the video icon. The second part offers practice with the solution for each problem only a click of the light bulb away.Guided Practice
Graphing Practice
Graphing Piecewise Functions WorksheetAnswer Key
Graphing Piecewise Functions Answer Key
Piecewise Practice
Piecewise Function WorksheetAnswer Key
Piecewise Function Answer KeySources
Arizona State University, "Graphing Piecewise Functions." http://fym.la.asu.edu/~tturner/MAT_117_online/piecewisefunction/Piecewise.htm (accessed 09/11/2010).
Carmel Clay Schools, "Graphing Piecewise worksheet." www.ccs.k12.in.us/chsteachers/pbeck/Algebra%202/Chapter%202/Piecewise%20Worksheet.pdf (accessed 09/11/2010).
Holt, Rinehart, and Winston, "Write and Graph Piecewise Functions." http://my.hrw.com/math06_07/nsmedia/homework_help/alg2/alg2_ch09_02_homeworkhelp.html (accessed 08/24/2010).
PassMathClass.com, "Piecewise Functions." http://passmathclass.com/ l_piece.html (accessed 09/11/2010).
Prentice Hall, "Graphing Piece-Wise Functions." http://www.prenhall.com/ divisions/esm/app/graphing/ti83/Graphing/Special_graphs/piece_wise/piece_wise.html (accessed 09/11/2010).
University of Georgia, "Piecewise Linear Functions." http://jwilson.coe.uga.edu/EMT668/EMAT6680.Folders/Barron/unit/Lesson%204/4.html (accessed 09/11/2010).
