Which Function Is It?
| Site: | Clare-Gladwin RESD |
| Course: | Michigan Algebra I |
| Book: | Which Function Is It? |
| Printed by: | Guest user |
| Date: | Saturday, January 31, 2026, 4:09 PM |
Description
Which Function Is It?
Function Type
When modeling data, it is important to know which type of function best models the data. One way to decide which family of functions will model the data is to determine the shape of the graph. Recall the various shapes of the families of functions we have studied in this course.|
Linear |
Quadratic |
|
|
|
|
Exponential |
Cubic |
|
|
|
Modeling from Graphs
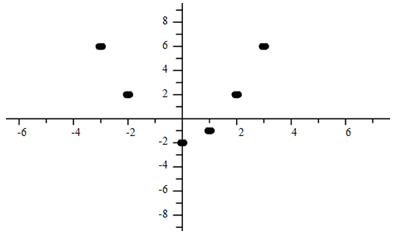
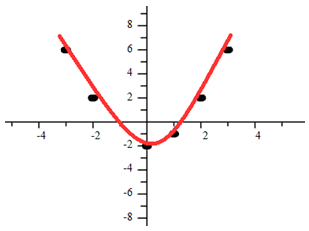
One way to determine which model works best is to plot the data points and look at the shape that is created.Example 1 Which model is most appropriate for this graph?
Solution
This appears to be a quadratic
Example 2
Which model is most appropriate for this graph? 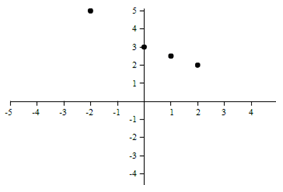
Solution
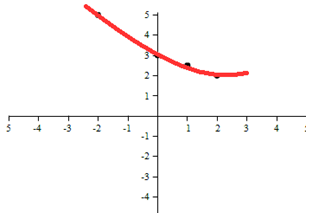
This appears to be exponential.
Example 3
Which model is most appropriate for this graph? 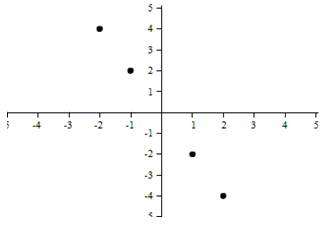
Solution
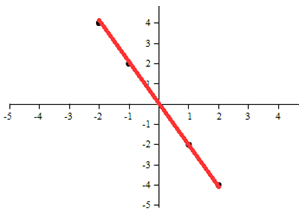
This appears to be linear.
Video Lesson
To learn how to determine which type of function is displayed the following link:Modeling From Tables
It is also possible to look at the table, without the graph, to find the best model. When doing this, use what was taught in previous lessons about common differences and ratios.For a linear function, the table will show a common first difference. For a quadratic function, the table will show a common second difference. For a cubic function, the table will show a common third difference. For an exponential function, the table will show a common ratio.
Example 1
Find the family of functions that models the data given in the table. 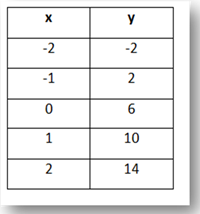
Step 1. Is there a common first difference?
Since the x-values are in an increment of 1, focus on the y-values. The first difference between each pair of consecutive y-values is +4.
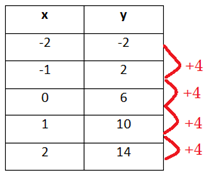
This means the table can be modeled by a linear function.
Example 2
What type of function would model this table? 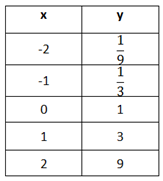
Step 1. Is there a common first difference?
The y-values do not have a common first difference.
Step 2. Is there a common second difference?
The y-values do not have a common second difference.
Step 3. Is there a common ratio?
The y-values have a common ratio of 3.
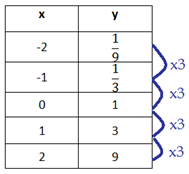
Therefore, the table can be modeled by an exponential function.
Example 3
What family of functions would model this table? 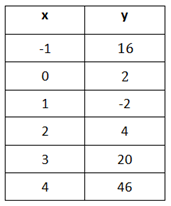
Step 1. Is there a common first difference?
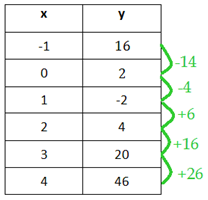
The y-values do not have a common first difference.
Step 2. Is there a common second difference?
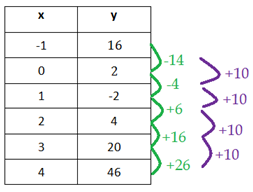
There is a common second difference; therefore, the table can be modeled by a quadratic function.
Video Lesson
To learn how to determine which type of function is displayed, watch the following video:Guided Practice
To solidify your understanding of determining which function is being displayed, visit the following link to Holt, Rinehart and Winston Homework Help Online. It provides examples, video tutorials and interactive practice with answers available. The Practice and Problem Solving section has two parts. The first part offers practice with a complete video explanation for the type of problem with just a click of the video icon. The second part offers practice with the solution for each problem only a click of the light bulb away.Practice
Which Function WorksheetAnswer Key
Which Function Answer KeySources
Embracing Mathematics, Assessment & Technology in High Schools; A Michigan Mathematics & Science Partnership Grant Project
Holt, Rinehart, & Winston. "Exponential & Radical Functions."
http://my.hrw.com/math06_07/nsmedia/homework_help/alg1/alg1_ch11_04_homeworkhelp.html (accessed September 3, 2010).
Khan, Salman. "Linear, Quadratic, and Exponential Models."
http://www.khanacademy.org/video/linear--quadratic--and-exponential-models (accessed September 12, 2010).


