Transformations
| Site: | Clare-Gladwin RESD |
| Course: | Michigan Algebra I |
| Book: | Transformations |
| Printed by: | Guest user |
| Date: | Saturday, January 31, 2026, 4:11 PM |
Description
Introduction
As with all families of functions, exponentials can be transformed from their parent function to create new curves in other areas of the coordinate plane. Exponential functions can be translated up, down, left or right and reflected across the x or y-axis.
Translating Up or Down
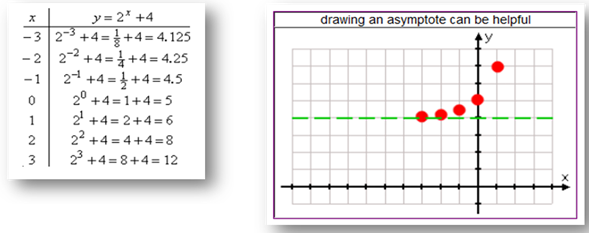
In order to graph the function y = 2x + 4, the graph of y = 2x is translated up 4 units on the coordinate plane. This will shift the asymptote of the graph from y = 0 to y = 4. Note on the table below, the y-intercept has shifted up 4 units from 1 to 5 and the decimal values are getting closer and closer to the number 4.

Therefore, adding a constant (k) will move the graph, and the horizontal asymptote up k units. Subtracting a constant (k) will move the graph, and the horizontal asymptote down k units.
Reflecting Across the x-axis
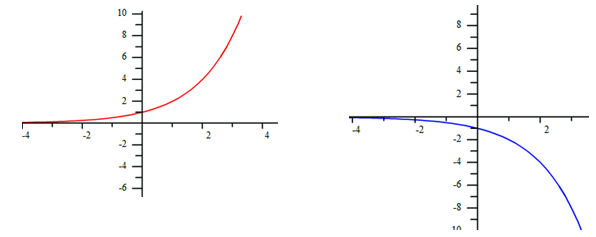
As previously discussed, when the a-value is negative, the graph of the parent function will be reflected across the x-axis. The graphs below show the parent function, y = 2x and the reflected curve y = -1(2x).

Reflecting Across the y-axis
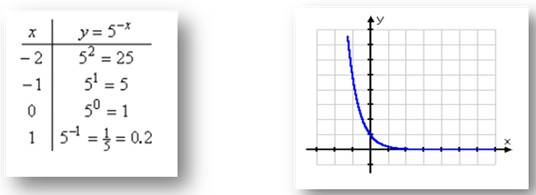
When the exponent is negative, the graph will be reflected across the y-axis. The table and graph below represent the function, y = 5 -x. Notice in the table, when the x-values are negative, the opposite value of x will be positive, so the graph will grow quickly on the left-hand side. On the other hand, when the x-values are positive, the opposite value of x will be negative, so the graph will stay very close to the x-axis.

This type of function is known as exponential decay. Any function with a negative exponent or a b-value between 0 and 1 will create a curve that decreases from left to right.
Translating Left or Right
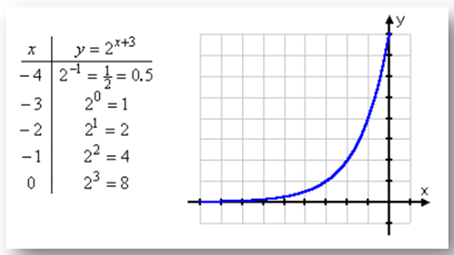
In order to graph the function y = 2(x + 3), graph the parent function, y = 2x but translate it 3 units to the left. This translation works much the same way as vertex form of a quadratic, where the number affecting the x on the inside of the parentheses changes signs when it translates the graph. Since this translation only shifts the graph left or right, it does not affect the asymptote. In the graph below, notice the original point (0, 1) has been translated to the left three units to the point (-3, 1).
Interactive Activity
To see how changing different parts of the graph of an exponential function change the graph, select the link below. Scroll down slightly to the heading "Interactive Tutorial Using Java Applet (1)" and click the button below the heading that says "click here to start."
Guided Practice
To solidify your understanding of transformations of exponential functions, visit the following link to Holt, Rinehart and Winston Homework Help Online. It provides examples, video tutorials and interactive practice with answers available. The Practice and Problem Solving section has two parts. The first part offers practice with a complete video explanation for the type of problem with just a click of the video icon. The second part offers practice with the solution for each problem only a click of the light bulb away.
Practice
Exponential Functions Worksheet
*Note: If Google Docs displays "Sorry, we were unable to retrieve the document for viewing," refresh your browser.
Answer Key
*Note: If Google Docs displays "Sorry, we were unable to retrieve the document for viewing," refresh your browser.
Sources
Dendane, A. "Exponential Functions." 11/27/2007.http://www.analyzemath.com/expfunction/expfunction.html (accessed 9/15/2010).
Holt, Rinehart, & Winston. "Exponential and Logarithmic Functions. "http://my.hrw.com/math06_07/nsmedia/homework_help/alg2/
alg2_ch07_07_homeworkhelp.html (accessed September 11, 2010).
Stapel, Elizabeth. "Graphing Exponential Functions. "http://www.purplemath.com/modules/graphexp.htm (accessed September 11, 2010).