Standard Form
| Site: | Clare-Gladwin RESD |
| Course: | Michigan Algebra I |
| Book: | Standard Form |
| Printed by: | Guest user |
| Date: | Sunday, February 1, 2026, 12:11 AM |
Description
Introduction
The slope-intercept form of the equation for a line states the slope of the equation explicitly, but the standard form does not. Since the slope is such an important feature of a line, it is useful to determine the slope if given the equation of the line in standard form. The standard form of the equation of a line is:
![]()
Rewrite the equation in slope-intercept form by solving the equation for y.
![]()
Compared with the slope-intercept form, y = mx + b, notice that ![]() . Remembering this relationship is useful, but solving the standard form for y will convert it to slope-intercept form where the slope and y -intercept are easily determined.
. Remembering this relationship is useful, but solving the standard form for y will convert it to slope-intercept form where the slope and y -intercept are easily determined.
Example 1
Find the slope and the y-intercept of ![]() by converting it to slope-intercept form.
by converting it to slope-intercept form.
Step 1. Move the x-term to the opposite side of the equation.

Step 2. Isolate the y and simplify.
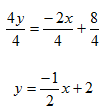
Step 3. Determine the slope and y-intercept.
![]()
Example 2 Solutions
The slope ![]() and the y-intercept
and the y-intercept ![]() .
.
a) ![]()
b) ![]() .
.
c) ![]() .
.
Write Equations
To rewrite equations in standard form, ![]() , the x variable term must have a positive coefficient and the values of A and B must be integers.
, the x variable term must have a positive coefficient and the values of A and B must be integers.
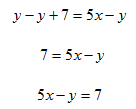
Example 1 Rewrite ![]() in standard form.
in standard form.
Step 1. Since the x coefficient is positive, add 7 to both sides of the equation.

Step 2. Subtract y from both sides of the equation.
Example 2
Write ![]() in standard form.
in standard form.
Step 1. Use the Distributive Property to remove the parentheses.
![]()
Step 2. Since the x coefficient is negative, add 3x to both sides of the equation.

Step 3. Add 2 to both sides and rearrange.

Example 3
Write ![]() in standard form.
in standard form.
Step 1. Eliminate the fractions by multiplying both sides of the equation by the least common multiple, 6.
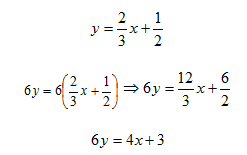
Step 2. Since the x coefficient is positive, subtract 3 from both sides of the equation.
![]()
Step 3. Subtract 6y from both sides.

Intercepts
When a linear equation in two variables is given in standard form, Ax + By = C, often the two most convenient points (solutions) to find are called the intercepts: these are the points at which the line intersects the coordinate axes.
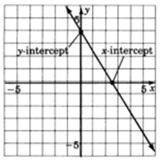
The point at which the line crosses the y-axis is called the y-intercept. The x-value at this point is zero. The y-intercept can be found by substituting the value of 0 for x into the equation and solving for y.
The point at which the line crosses the x-axis is called the x-intercept and the y-value at that point is zero. The x-intercept can be found by substituting the value of 0 for y into the equation and solving for x.
Graphing an equation by finding the intercepts is called the intercept method.
Example
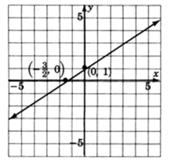
Graph ?2x + 3y = 3 using the intercept method.
Step 1. Find the y-intercept, let x = 0 and solve for y.
-2(0) + 3y = 3
0 + 3y = 3
3y = 3
y = 1
Thus, we have the point (0, 1).
Step 2. Find the x-intercept, let y = 0 and solve for x.
-2x + 3(0) = 3
-2x + 0 = 3
-2x = 3

Thus, we have the point  .
.
Example Continued
Step 3. Plot the two points and draw a line through them. Keep in mind that all the solutions to the equation ?2x + 3y = 3 are precisely on this line.
Cover-up Method
Another way to graph an equation in standard form is to use the cover-up method to find the intercepts of the line.
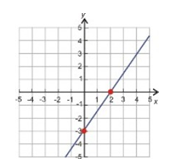
Example Graph 3x - 2y = 6 using the cover-up method.
Step 1 . To find the x-intercept, cover up the y term and solve for x.

The x-intercept is (2, 0).
Step 2 . To find the y-intercept, cover up the x term and solve for y.

The y-intercept is (0, -3)
Step 3. Plot the intercepts and draw a line through that extends in both directions.
Video Lesson
To learn how to graph a line using standard form, select the following link:
Finding x-intercepts and y-intercepts to Graph Linear Equations
Guided Practice
To solidify your understanding of graphing using standard form, visit the following link to Holt, Rinehart and Winston Homework Help Online. It provides examples, video tutorials and interactive practice with answers available. The Practice and Problem Solving section has two parts. The first part offers practice with a complete video explanation for the type of problem with just a click of the video icon. The second part offers practice with the solution for each problem only a click of the light bulb away.
Horizontal & Vertical Lines
If only one variable appears in the standard form, then the line will be either vertical or horizontal.
For example 3x = 9 is an equation in standard form with the y-term missing. Any value can be chosen for y, but the value of x will always be 3. The ordered pairs generated will have the form (3, y). Ordered pairs such as (3, -1), (3, 0), (3, 1) will be on this line. Graphing these points will create a vertical line.
If the standard form eliminates the x-term, such as -2y = 4, then any value can be chosen for x but the y-value will remain -2. Resulting in a set of ordered pairs of the form (x, -2). Graphing these points will create a horizontal line.
Examples
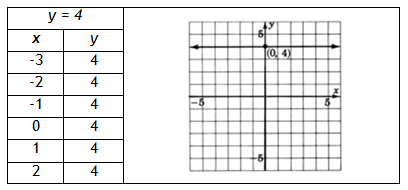
Example 1 Graph y = 4.
The only variable appearing is y. Regardless of which x-value is chosen, the y-value is always 4. All points with a y-value of 4 satisfy the equation. Thus the graph is a horizontal line 4 units above the x-axis.
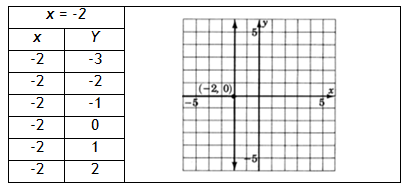
Example 2 Graph x = ?2.
The only variable that appears is x. Regardless of which y-value is chosen, the x-value will always be ?2. The resulting graph is a vertical line two units to the left of the y-axis.
Summary
When a linear equation in two variables is written in the form Ax + By = C, it is written in standard form. To graph an equation in standard form it is sometimes convenient to use the intercept method. A linear equation in which both variables appear will graph as a diagonal line. A linear equation in which only one variable appears will graph as either a vertical or horizontal line.
Practice
Graphing Linear Equations in Standard Form Worksheet
*Note: If Google Docs displays "Sorry, we were unable to retrieve the document for viewing," refresh your browser.
Answer Key
Graphing Linear Equations in Standard Form Answer Key
*Note: If Google Docs displays "Sorry, we were unable to retrieve the document for viewing," refresh your browser.
Sources
Burzynski, Wade Ellis and Denny. "Graphing Linear Equations and Inequalities: Graphing Linear Equations in Two Variables," Connexions." June 1, 2009.http://cnx.org/content/m21995/1.4/
Gloag, Anne & Andrew. ""Writing Linear Equations", CK-12 Foundation's Algebra FlexBook." December 9, 2009.http://www.ck12.org/flexr/flexbook/738/
Holt, Rinehart, & Winston. "Graphing Lines." http://my.hrw.com/math06_07/
nsmedia/homework_help/msm3/msm3_ch12_03_homeworkhelp.html (accessed August 13, 2010)