Graphing
Solving Equations
Example Continued
Step 4. Find the intersection point.
Option 1: Use [TRACE] and move the cursor with the arrows until it is on top of the intersection point. The values of the coordinate point will be on the bottom of the screen. Using the window above, the values will be x = 4.0957447 and y = 0.03191489. These are approximations due to the pixels on the graph screen.
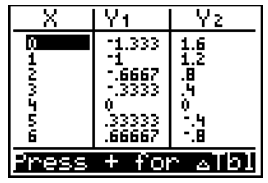
Option 2: Look at the table of values by pressing [2nd] [GRAPH]. The screen below shows a table of values for this system of equations. Scroll down until the values for y1 and y2 are the same. In this case, this occurs at x = 4 and y = 0.

Option 3: Using the [2nd] [TRACE] function will allow you to calculate a value.
- Press [ENTER] and the calculator displays the solution at the bottom of the screen
The point of intersection is x = 4 and y = 0.